The markets and the Fed now are in agreement on one thing: something will have to break in order to get inflation under control.
Today’s stock market reversal highlights this new parallel thinking:
The Fed is focused on the labor market and believes it must loosen (i.e., there needs to be higher unemployment) in order for prices finally to ease.
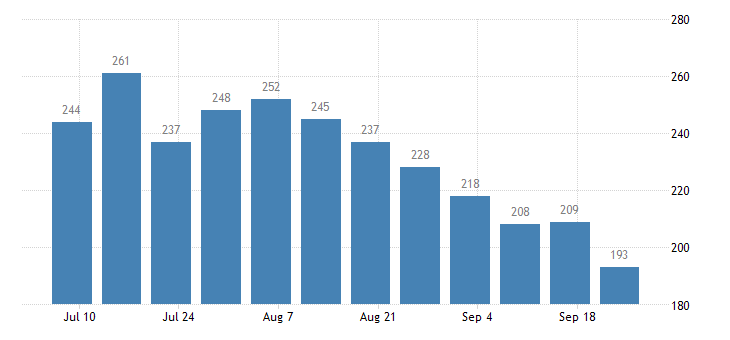
Weekly jobless claims came in today below expectations and have continued to fall steadily since July.
And so good economic news—more people have jobs—is bad market news because it means more rate hikes from the Fed.
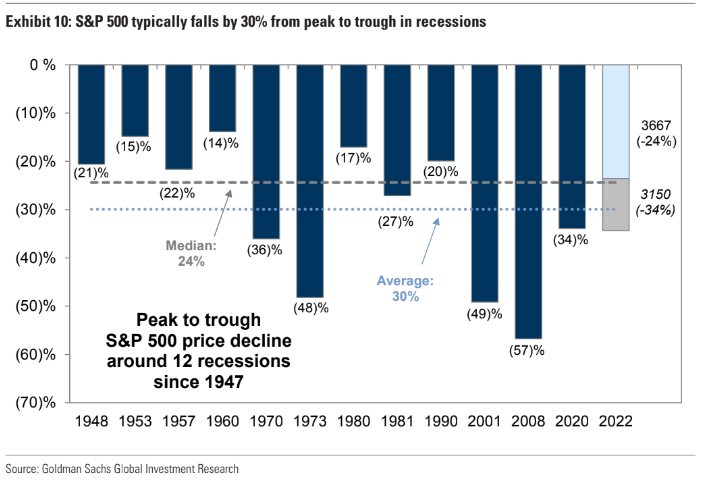
The S&P 500 is set to fall to a new bottom today (it’s about -24% away from its peak).
The average drawdown for the S&P 500 around recessions is -30%.
The headline index has closed negative 56% of its trade days so far this year. Since 1957 this is the index’s second-most negatively-biased year. The most negative year (in terms of closing negative) was 1974 when 58% of trade days were negative.
Just 15% of S&P 500 companies are trading above their 200-day moving average; just 7% are trading above their 50-day moving average.
The Dow fell into a bear market for the first time since 2020. Both the Dow Industrials and Dow Transportation Averages are in bear markets. Long Treasuries are having their worst 1-year performance ever (they’re now down over -30% year-over-year). Including inflation to give us the real return, this is the worst performing year ever for the 60/40 portfolio.
The 60/40 is down -20% ytd. With inflation it’s down -27%, worse than 1974’s terrible real return of -25%.
KEY TAKEAWAYS
Good economic news is bad news for markets.
Volatility will persist into the next quarter in response to economic data and the upcoming earnings season.
The VIX is climbing and is elevated, but is not yet at extreme levels.
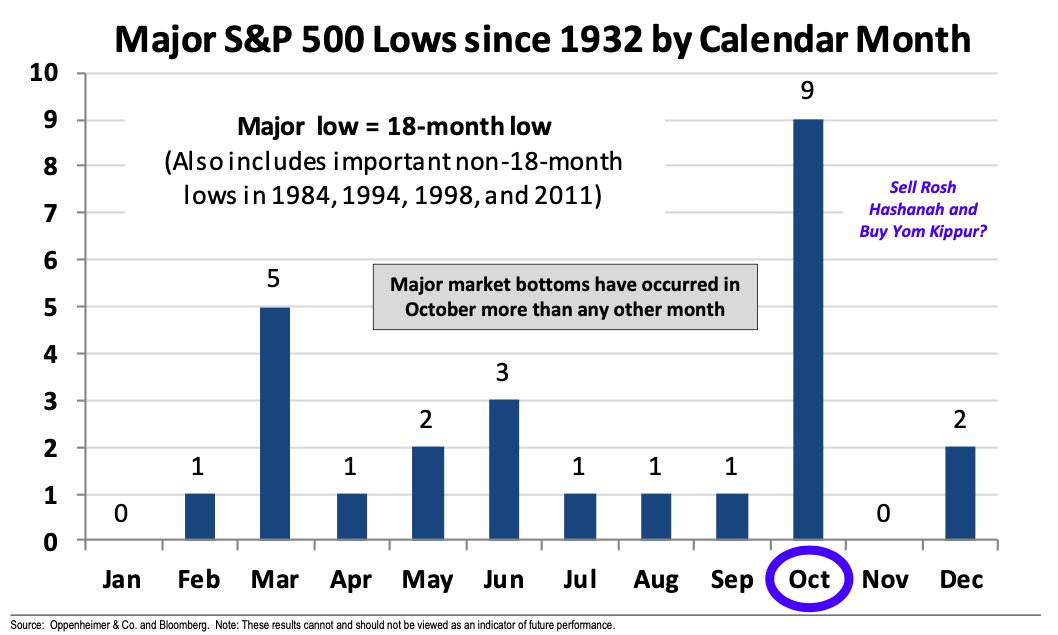
October is historically the market’s most volatile month.
More market bottoms have been reached in October than in any other month.
The tactical stance will be to preserve and protect in the face of ever more volatile markets. The software will be looking for durable trends should a firm bottom be put in. Catalysts are few and far between.
MARKET CHARTS
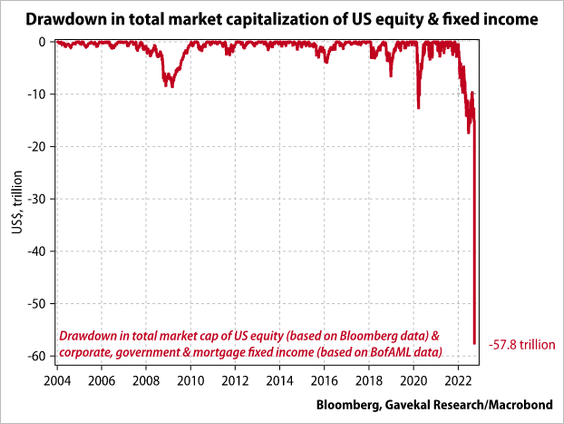
EXHIBIT 1 - this drawdown has been historic
This chart from Gavekal Research shows the total market cap lost to this year’s bear markets in stocks and bonds. The total comes to -$57.8 trillion capitalization shaved off so far this year.
EXHIBIT 2 - Volatile October, friend to finding the bottom
TITLE
Suspendisse lobortis diam molestie enim facilisis, eget malesuada sapien vestibulum. Suspendisse at sapien augue. Morbi ex felis, commodo a dui sit amet, ullamcorper bibendum elit.
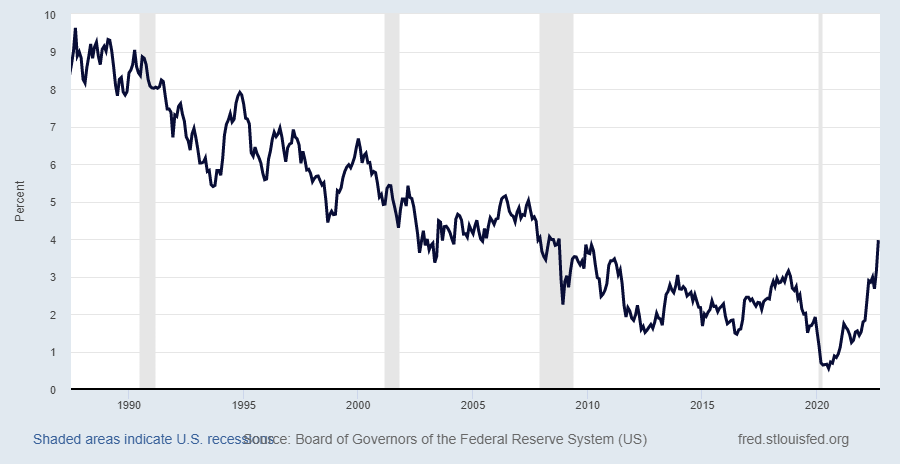
EXHIBIT 3 - End of bull market in bonds?
We’ve seen this year a definite break in 35-year decline in bond yields. There have been breaks over previous highs before, but this most recent breakout is significantly larger than those others.
EXHIBIT 4 - S&P Averages -30% drawdown around recessions
We’ve seen this year a definite break in 35-year decline in bond yields. There have been breaks over previous highs before, but this most recent breakout is significantly larger than those others.
EXHIBIT 5 - initial jobless claims
Needless to say, this is not what the Fed wants to see from the labor market in their quest to kill inflation.
Such data will reinforce the Fed’s stated decision to double-down and continue to attack inflation quickly and forcefully.
The views expressed above reflect the views of EdgeTech Analytics, LLC and are for informational purposes only. These views are not intended to serve as a substitute for personalized investment advice. Past performance is no guarantee of future results and no investment strategy or methodology can guarantee profits or protect against losses.