This is a relatively quiet week data-wise for markets but that hasn’t stopped the incredible volatility we are seeing.
Invigorated by decent earnings beats and fresh evidence of a slowing economy (see the regional manufacturing indexes), stocks got off to a headstart on Monday as 99% of S&P 500 stocks advanced.
Evidence of a bottom having been put in?
Monday’s rally was led by this year’s worst performers (think ARKK components), so it was most likely a short-covering rally…and just more noise.
Speaking of noise, over half of the S&P 500’s moves this month have been over 1%, and of those days, all but two have been moves of great than 2.4% in either direction.
Such whipsawing, we think, is indicative not of a bullish breakout but of the profound uncertainties facing markets in the months ahead.
Inflation, interest rates, elections, Ukraine, UK turmoil, oil markets, earnings, recession. All of these throw a monkey wrench into any narrative to develop that would spark a catalyzing rally.
Earnings so far have helped burnish the market this week with Monday and Tuesday’s decent advances. Recall, though, that these earnings are backward-looking and that the economy is still running at a decent clip, all things considered.
As Al Scofield stated, we’re not even in the first quarter of this slowdown; we’ve not even left the tunnel and gotten onto the field.
Amazon CEO Jeff Bezos tweeted on Tuesday, “The probabilities in this economy tell you to batten down the hatches.”
Bond yields are reflecting the anticipated continued Fed rate hikes. The ten year has climbed up to 4.23%, its highest level since 2007. Persistently higher yields are not conducive to appreciating stock prices.
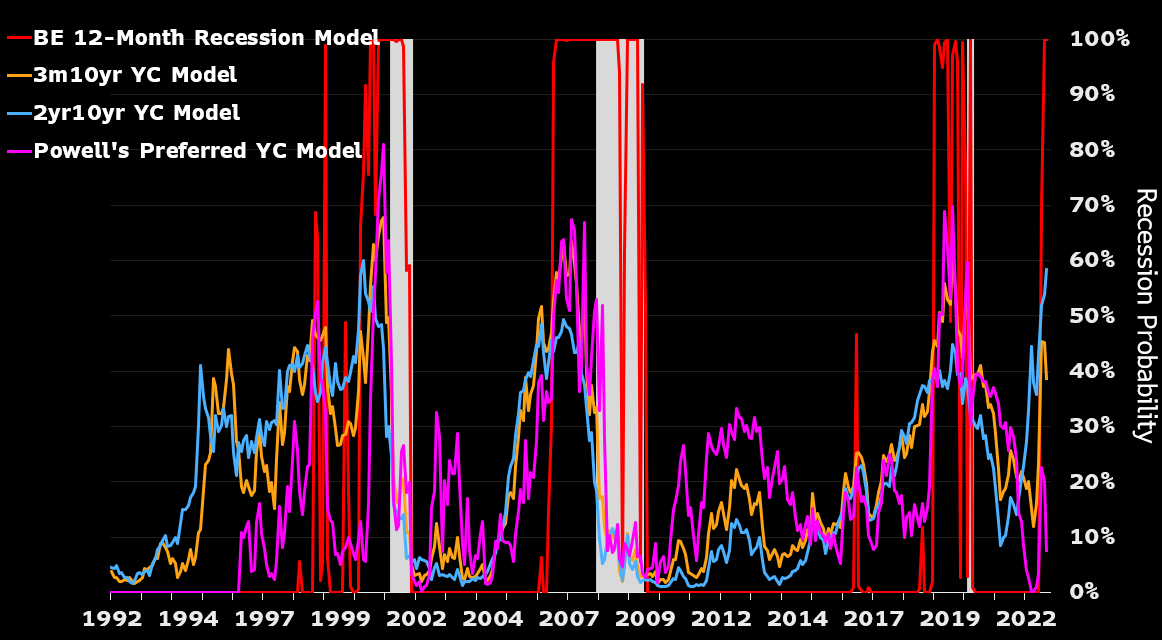
And among the different yield curves, the 3month/10year curve had avoided inversion all year…until this week. The curve finally inverted on Tuesday (it’s back in positive territory with the 10-year climbing higher these past two days.
Futures are putting the terminal Fed Funds rate (i.e., where they stop) at 5% next year (it’s between 3 and 3.25% now).
KEY TAKEAWAYS
Nothing but volatility all the way down as the market has little to trade on but ongoing uncertainty.
The tactical stance will be to preserve and protect in the face of ever more volatile markets. The software will be looking for durable trends should a firm bottom be put in. Catalysts are few and far between.
MARKET CHARTS
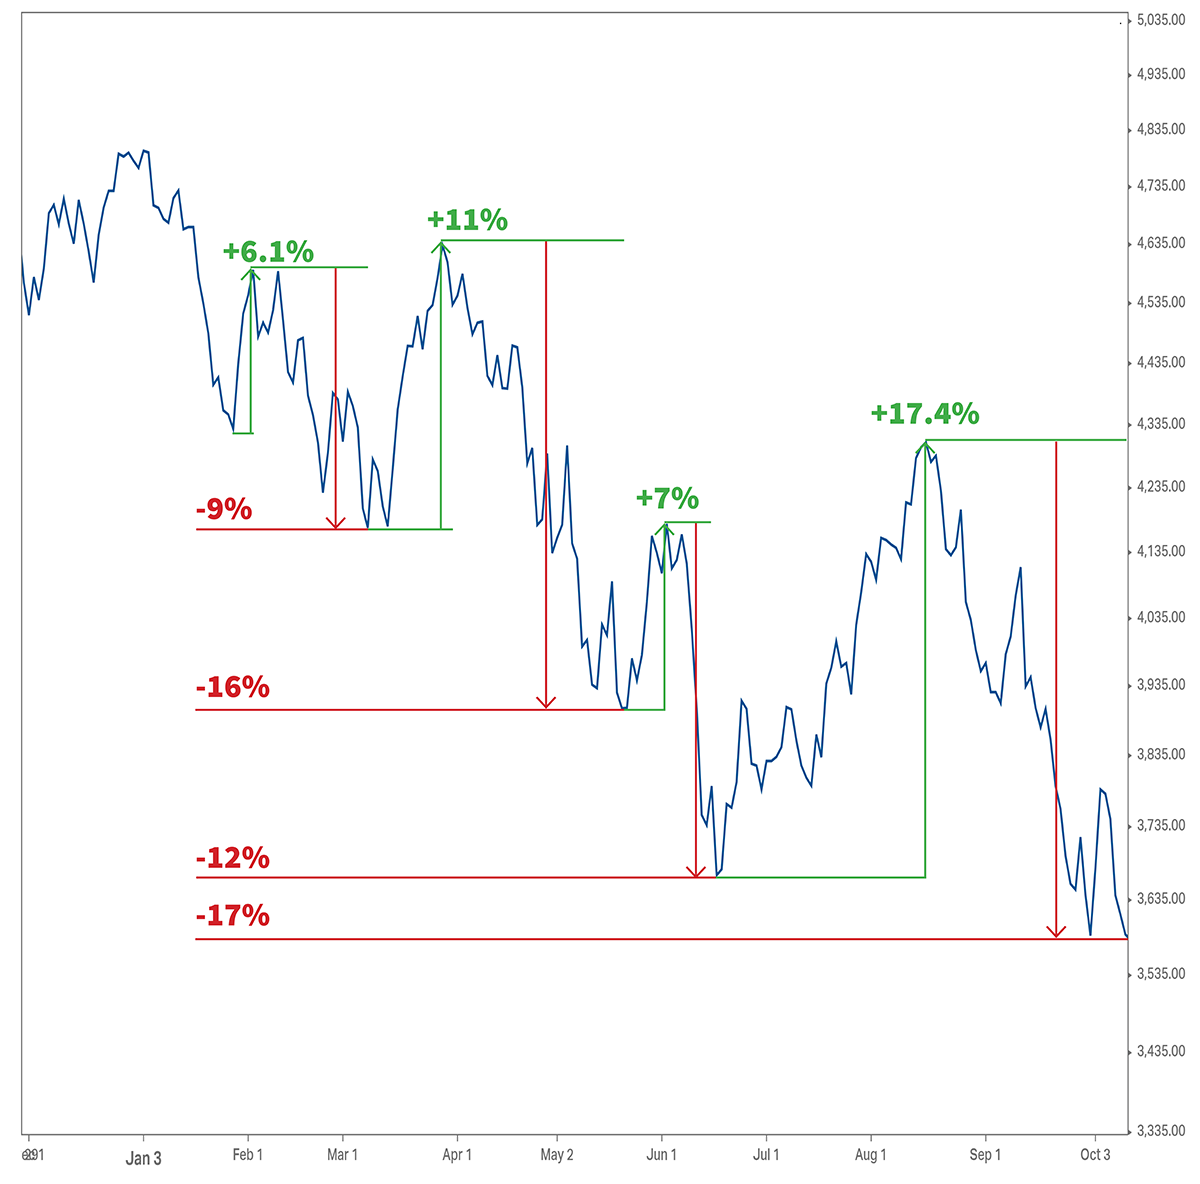
EXHIBIT 1 - bear rallies and subsequent falls
This chart puts a different spin on the Bear Market Rallies chart we’ve shared in the past in that it shows the % drops that occur after the market rallies.
As you can see, the subsequent drops have exceeded or equalled the amount of the rally.
The views expressed above reflect the views of EdgeTech Analytics, LLC and are for informational purposes only. These views are not intended to serve as a substitute for personalized investment advice. Past performance is no guarantee of future results and no investment strategy or methodology can guarantee profits or protect against losses.