Stocks having their worst single day performance since June on Chairman Jerome Powell reiterating what he’s been saying all year long: the Fed is dead set on fighting inflation and will not pull back on rate hikes until they see enough evidence that prices are coming down.
The Fed is intent on not repeating the mistakes of the 1970s where they prematurely loosened monetary conditions which led to inflation’s resurgence later in the decade.
Because of this, the market’s hoped-for “dovish pivot” seems unlikely at least through the end of this year.
Powell committed the Fed to “taking forceful and rapid steps” and to “keep at it until we are confident the job is done.” (emphasis added).
Today’s volatility is noise—recall that a market pricing in perfection makes it extremely fragile—but it does indicate a resetting of expectations to a more realistic bent.
Inflation is still much too high and tighter financial conditions will hurt the economy and company bottom lines.
Sideways and negative volatility through the market’s worst month, September, are to be expected in the run up to the next round of rate hikes on the 21st.
POSITIVES:
University of Michigan Consumer Sentiment for August, while still low, beat expectations.
Inflation expectations, which play a significant role in the life cycle of rising prices, decreased in August.
Q2 GDP growth was revised upward; it’s still negative but not as deeply negative.
PCE inflation, the Fed’s preferred measure, eased in July month-over-month and year-over-year.
NEGATIVES:
S&P Composite business activity index came in at contraction levels for the month.
Regional manufacturing indexes continue to show deep contractionsin activity.
Trimmed Mean PCE inflation (this excludes all outlier prices) still advanced in July although the pace of the increase was mild.
KEY TAKEAWAYS
Sideways and negative volatility through September for equity markets.
The Nasdaq is still in a bear market (-23% away from its high) and the S&P is still -14% from its high.
We’re keeping an eye on the 10-year Treasury yield.
The yield headed north of 3% with the Fed’s latest hawkishness and stock swoon.
It peaked at 3.48% in June right around the stock market’s bottom.
The Fed is committed to smashing inflation and the market has to come to terms with the implications for the economy and balance sheets.
MARKET CHARTS
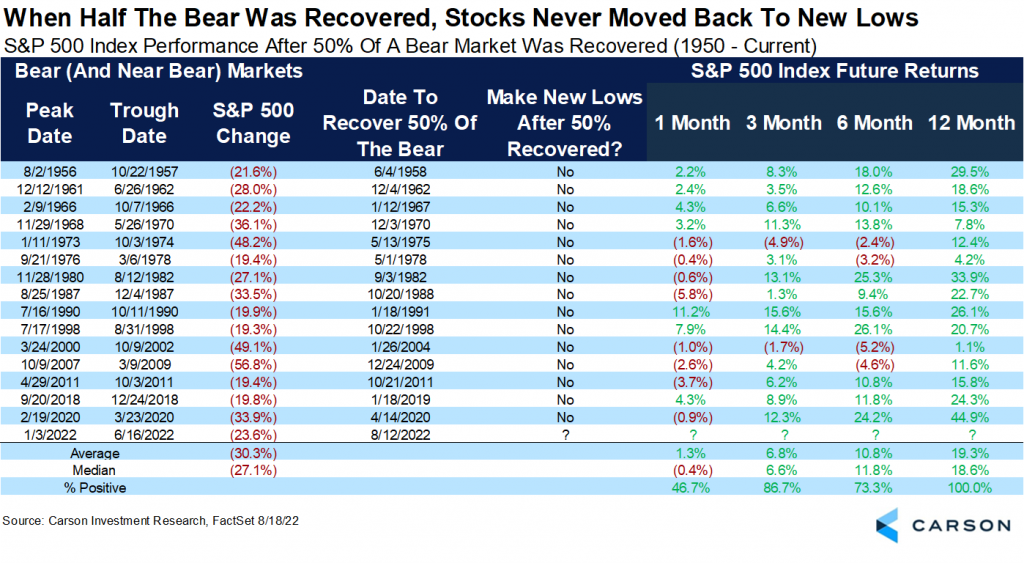
EXHIBIT 1 - Post 50% Recovery mark a bottom?
Of the 16 times the S&P 500 has dropped -20% and recovered 50% of those losses, it has never made a new low.
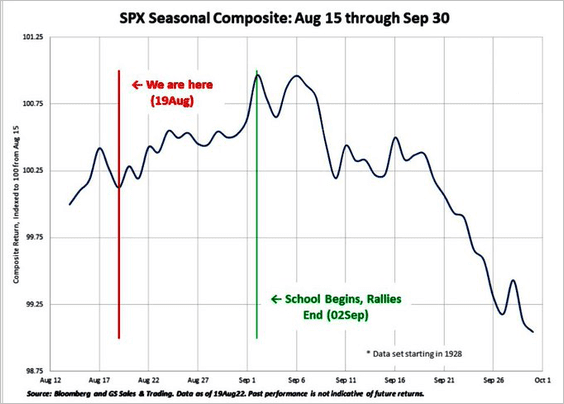
EXHIBIT 2 - Don’t want to see you in September
Post-Summer markets have historically underperformed (the average monthly performance is -.7%).
After September and October volatility, however, the market tends to rise throught the end of the year.
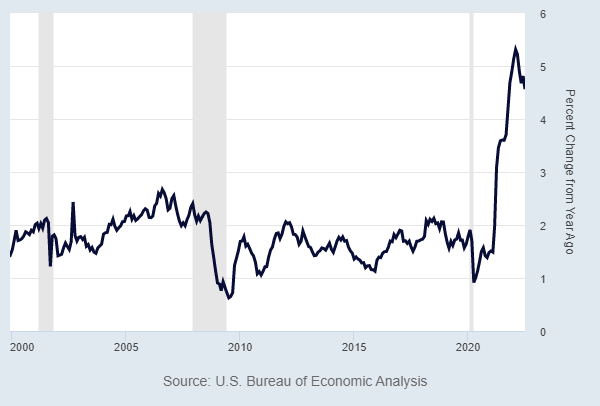
EXHIBIT 3 - Inflation easing, remains high
The Fed’s favorite measure of inflation, the Personal Consumption Expenditures (PCE) index excluding food and energy, continues to trend downward year-over-year. Note that it’s still at 4.6%, more than double the preferred rate of inflation.
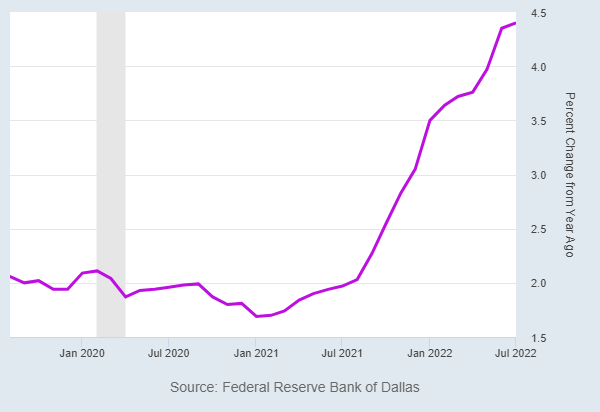
The Trimmed Mean PCE number removes both positive and negative outliers and still shows prices increasing, albeit at a slower rate than we saw in June.
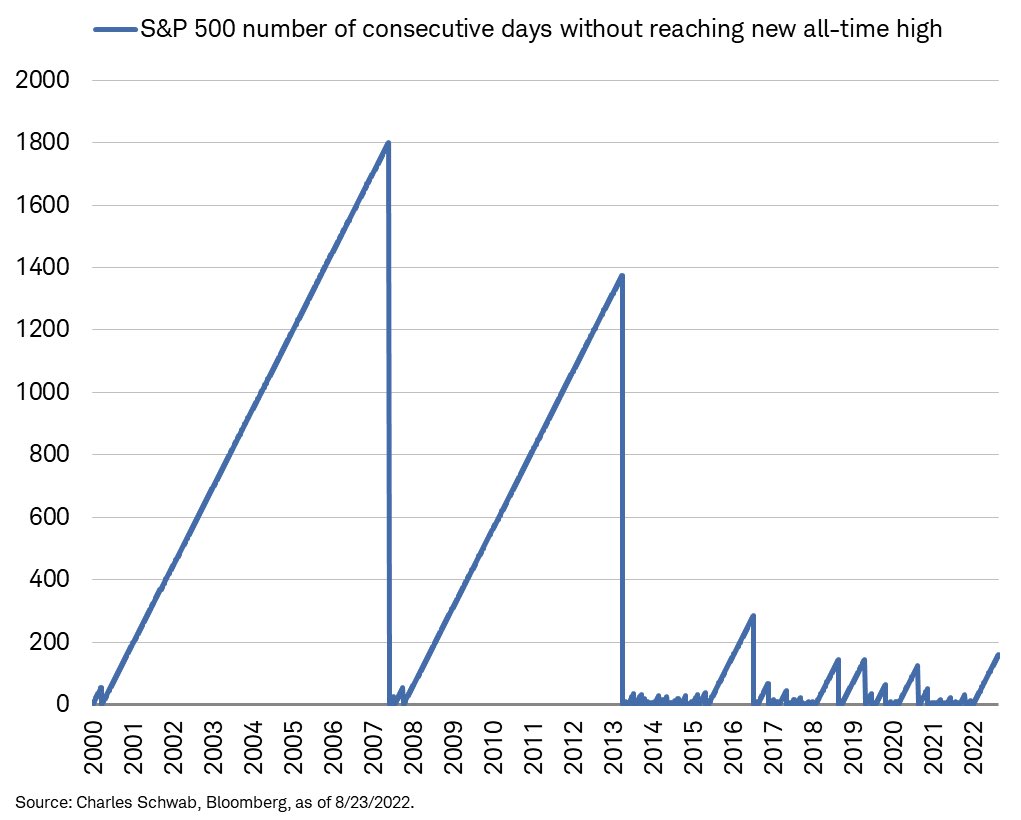
EXHIBIT 4 - Bear Market Perspectives
As you can see the 2000s bear markets went thousands of days without reaching new highs. We’re currently at 162 days.
Important Disclosures: The views expressed above reflect the views of EdgeTech Analytics, LLC and are for informational purposes only. These views are not intended to serve as a substitute for personalized investment advice. Past performance is no guarantee of future results and no investment strategy or methodology can guarantee profits or protect against losses.
Internal market momentum cannot and should not be ignored.
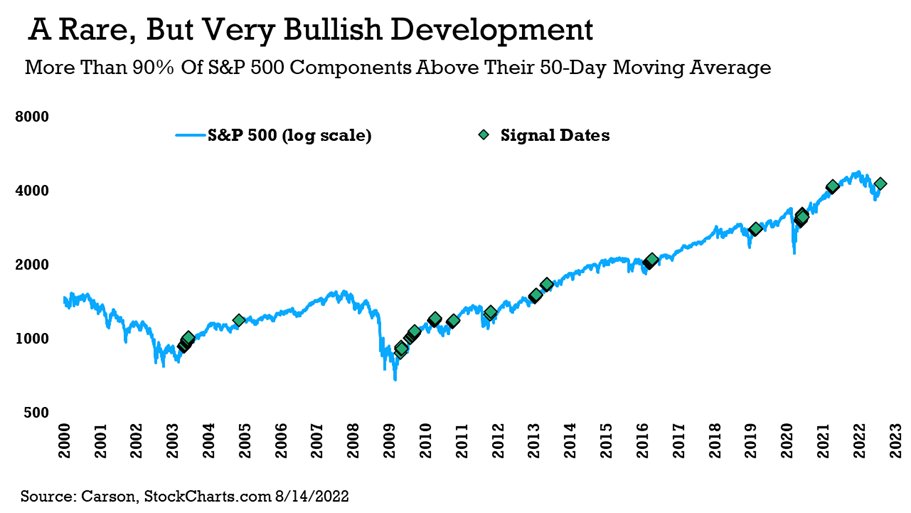
Unlike the rallies earlier this year, this latest rally is showing broad participation and real momentum.
Over 90% of S&P 500 stocks are trading above their 50-day moving average. In contrast, during March’s growth rally only 74% of stocks were trading at those levels and that level was reached for only a single trade day. We’ve had over 90% now for 4 straight trade days.
The S&P 500 recovered over 50% of its losses last Friday (the “retracement” we discussed last week). Equity returns 2 and 3 months out following such recoveries have been positive in almost all cases. Not a guarantee but a decent signal of forward momentum.
Breadth has improved: the percentage of S&P 500 stocks hitting new 20-day highs reached over 55%. This is a bullish signal that’s only occurred 28 other times since the 1970s. The last time it happened recently was May 2020.
It is impossible to say whether this is another dead-cat bounce or a new bull breakout, though the momentum indicates further upside potential in the short term (see charts below).
The stock market is pricing in perfection: inflation gradually recedes, the Fed eventually pivots, and the economy lands softly.
Pricing for perfection means extreme fragility: any negative inflation data point has the potential to burst this bubble of optimism.
The Fed’s July meeting minutes revealed that they’re happy about July’s inflation moderating though they remain committed to stamping out inflation.
They will be data-dependent going forward and gave no hint of a pivot.
The Fed saw “little evidence to date that inflation pressures were subsiding.” More hikes coming.
Next Friday we get July’s Personal Consumption Expenditures data (the Fed’s preferred measure of inflation).
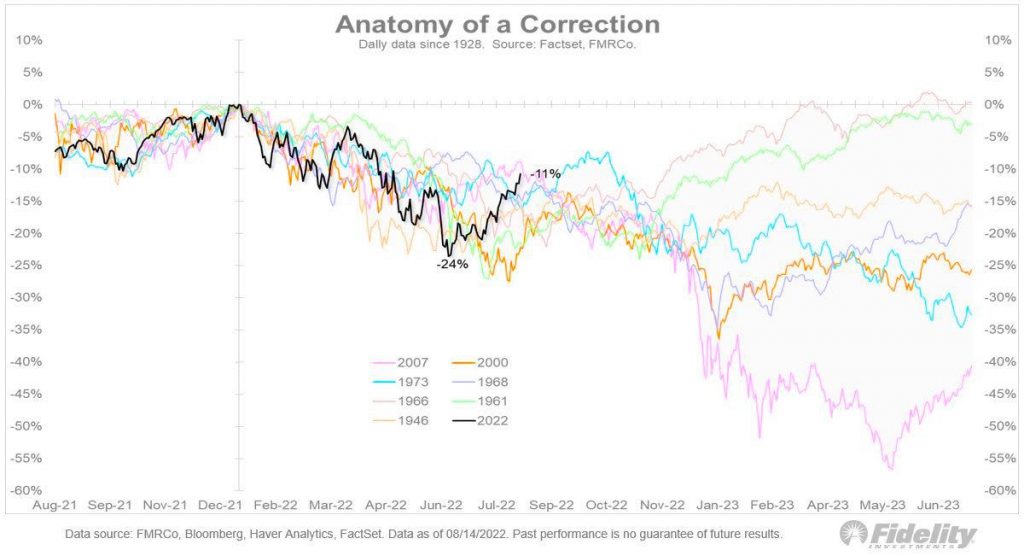
Bear Rally/Bull Breakout?
As you can see from this chart, the magnitude of this latest rally is not unusual for bear markets (2022 is the black line).
This rally, however, has had legitimate momentum and participation indicating further upside.
This infrequently seen number is used as one of the signals for a potential bull market breakout.
Note the dates of other occurrences and performance of the stock market post the 90% trigger being met.
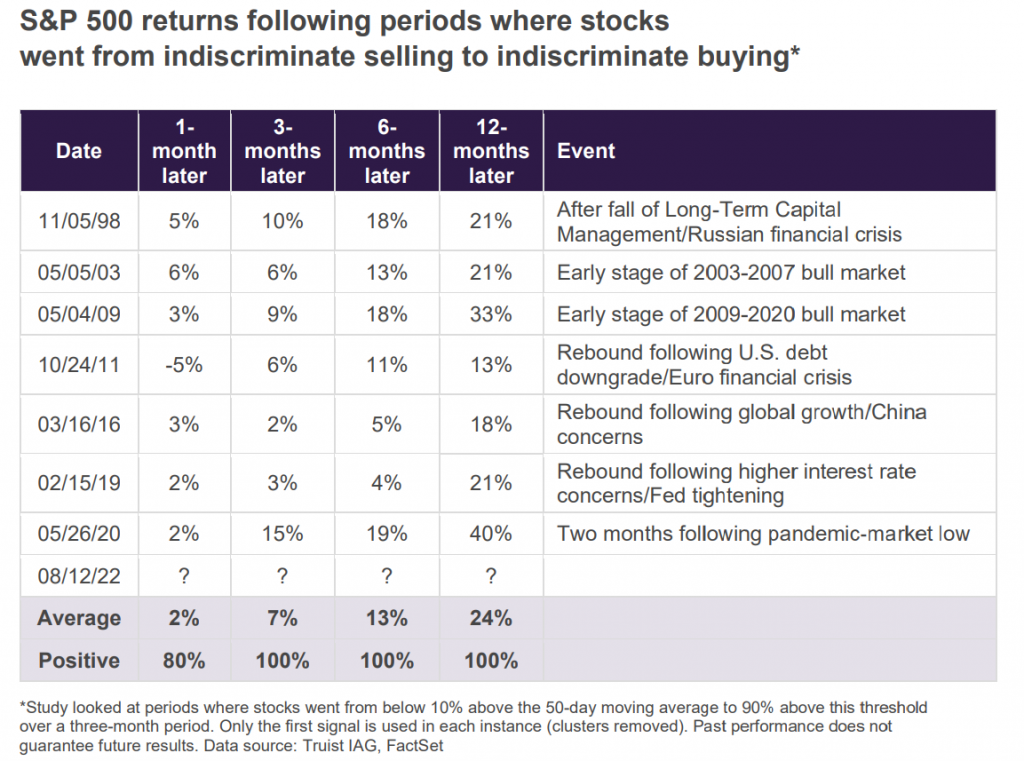
EXHIBIT 2 - From indiscriminate selling to indiscriminate buying a good sign
This chart looks at times when just 10% of the S&P 500’s stocks that were trading above their 50-day moving average went to over 90% trading above it in 3-month periods.
Going from indiscriminate selling to buying has been positive for forward stock performance in the past.
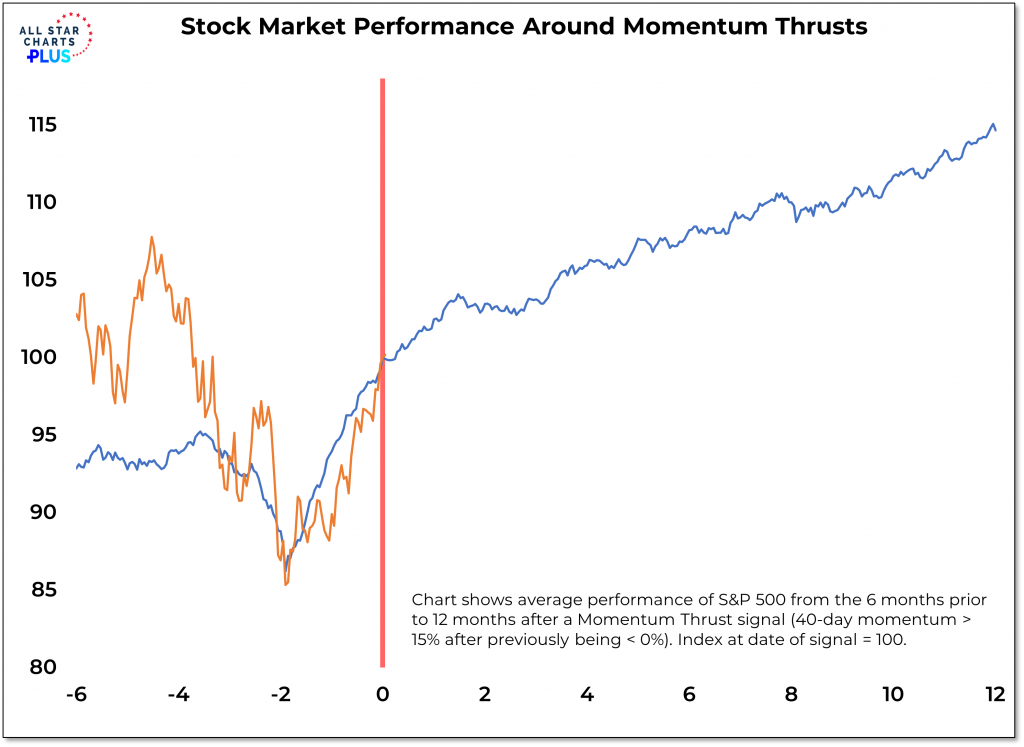
EXHIBIT 3 - Momentum Thrusts
Again, this is a market priced for perfection at some point in the future and is extremely vulnerable to external shocks or inflation data coming in higher than expected.
That being said, the momentum of this current rally indicates the potential for further positive returns going forward.
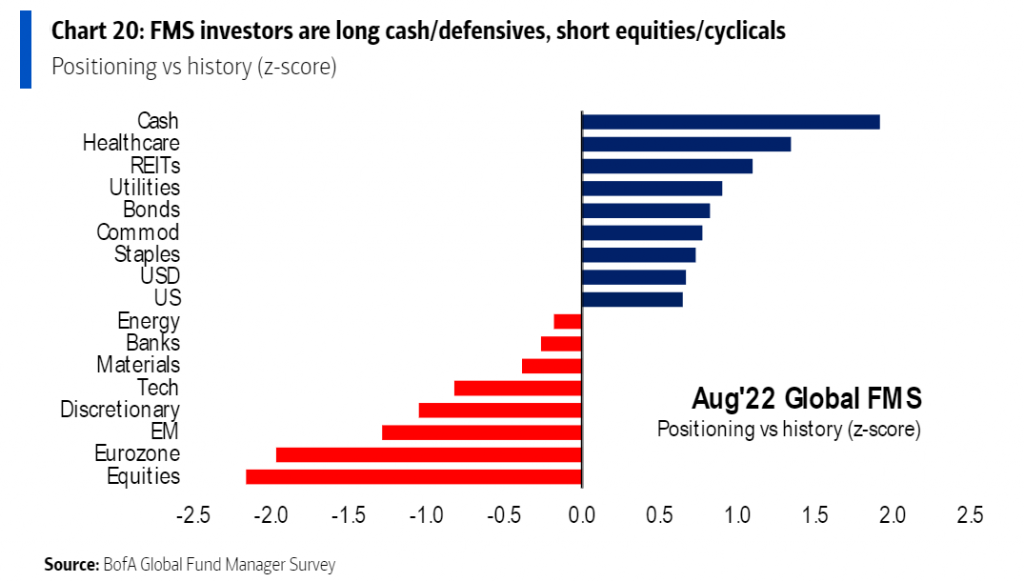
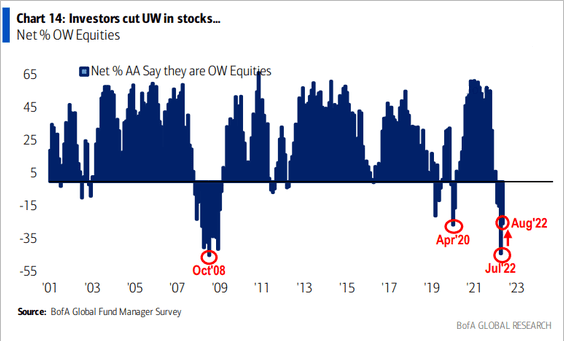
EXHIBIT 4 - Lots of cash on sidelines/not yet participating
The August BofA fund manager survey showed fund managers still heavily in cash and underweight stocks.
Important Disclosures: The views expressed above reflect the views of EdgeTech Analytics, LLC and are for informational purposes only. These views are not intended to serve as a substitute for personalized investment advice. Past performance is no guarantee of future results and no investment strategy or methodology can guarantee profits or protect against losses.