Conflicting economic data this week only added to the general confused, unstable direction of markets.
The ISM Services PMI came in over expectations, increasing month-to-month, and in expansionary territory. The ISM Manufacturing PMI also came in over expectations staying flat in August.
Neither index is indicating recession and both continue to show steadily falling prices (good news for inflation).
Regardless, the Fed has made clear that further rate hikes are a certainty. The questions facing investors now are:
Will the Fed break something in its quest to quash inflation?
If it does, what will it break?
Look for deterioration in the housing market (definitely in a correction; still a ways to go to get back to normal), labor market (showing significant strength; few signs of loosening), broad economic demand (GDP), or the stock market (lower lows; lower multiples).
Is a soft landing possible?
Again the labor market is showing continued strength (jobless claims have fallen for 4 straight weeks; see also increased participation numbers from last week’s Talking Points), and manufacturing and services indexes continue to show expansionary levels with falling prices.
Stocks remain under pressure.
The S&P 500 remains down -17% from its peak.
The index has traded below its 200-day moving average for over 100 trade days. This is the longest streak since the Great Financial Crisis (2009).
The Nasdaq remains down -26% from its peak.
Like the S&P, the Nasdaq has traded below its 200-day moving average for over 100 trade days; also the index’s longest streak since 2009.
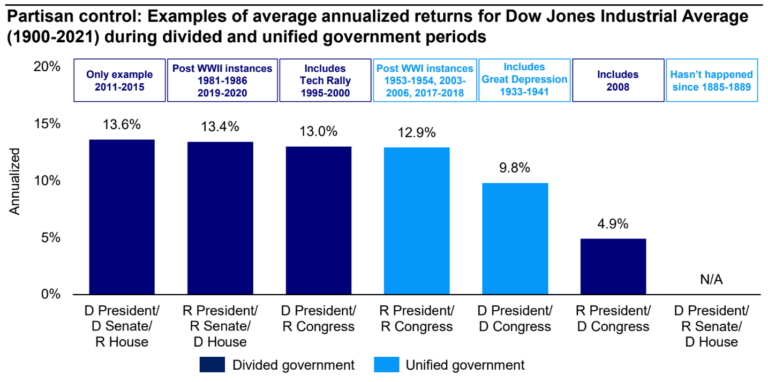
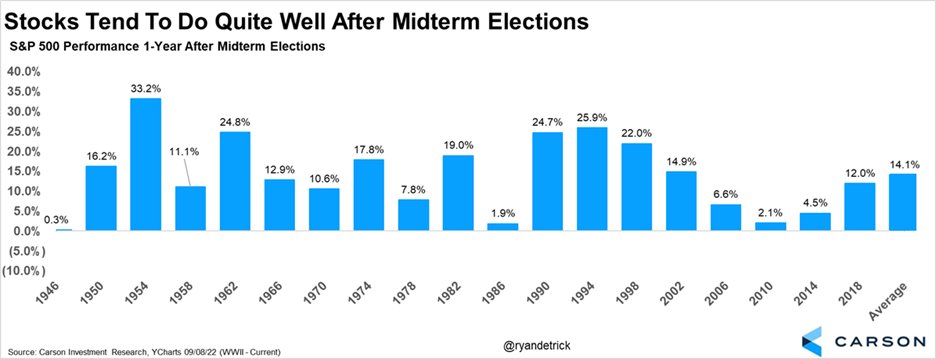
ELECTIONS APPROACHING
MARKETS LIKE DIVIDED GOVERNMENT, POST-MIDTERM YEARS
MARKET CHARTS
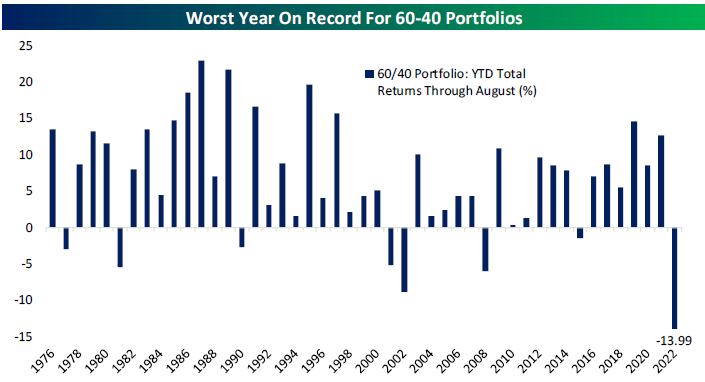
EXHIBIT 1 - aggregate bond index off to its worst-ever start
The AGG’s inception was 1976, before the runaway inflation of 1979-1980, and this year remains far and away the index’s worst start ever.
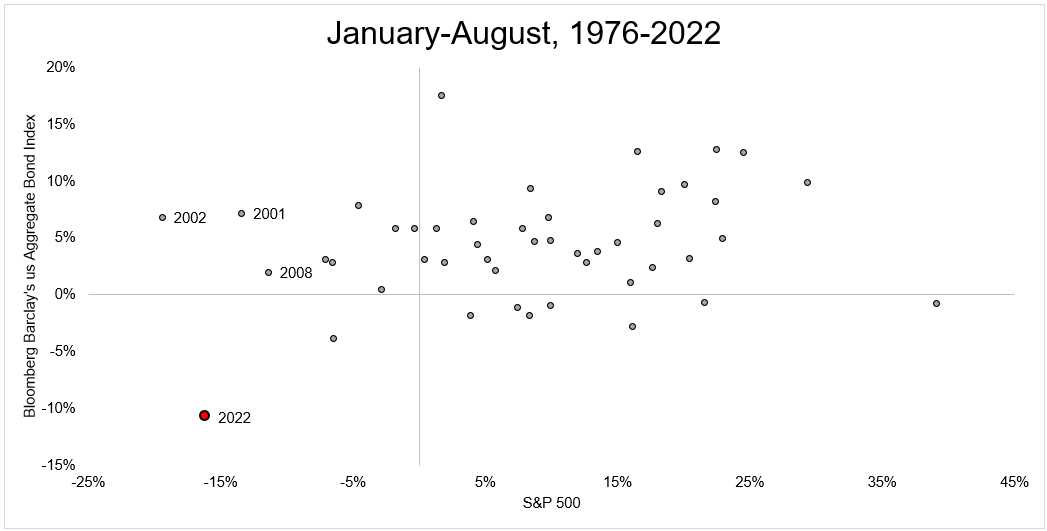
EXHIBIT 2 - 60/40 portfolio’s worst year on record
The chart below left, from Michael Batnick, charts the S&P 500 returns on the horizontal axis and the Aggregate bond return on the vertical axis. You can see that 2022 is in a league of its own.
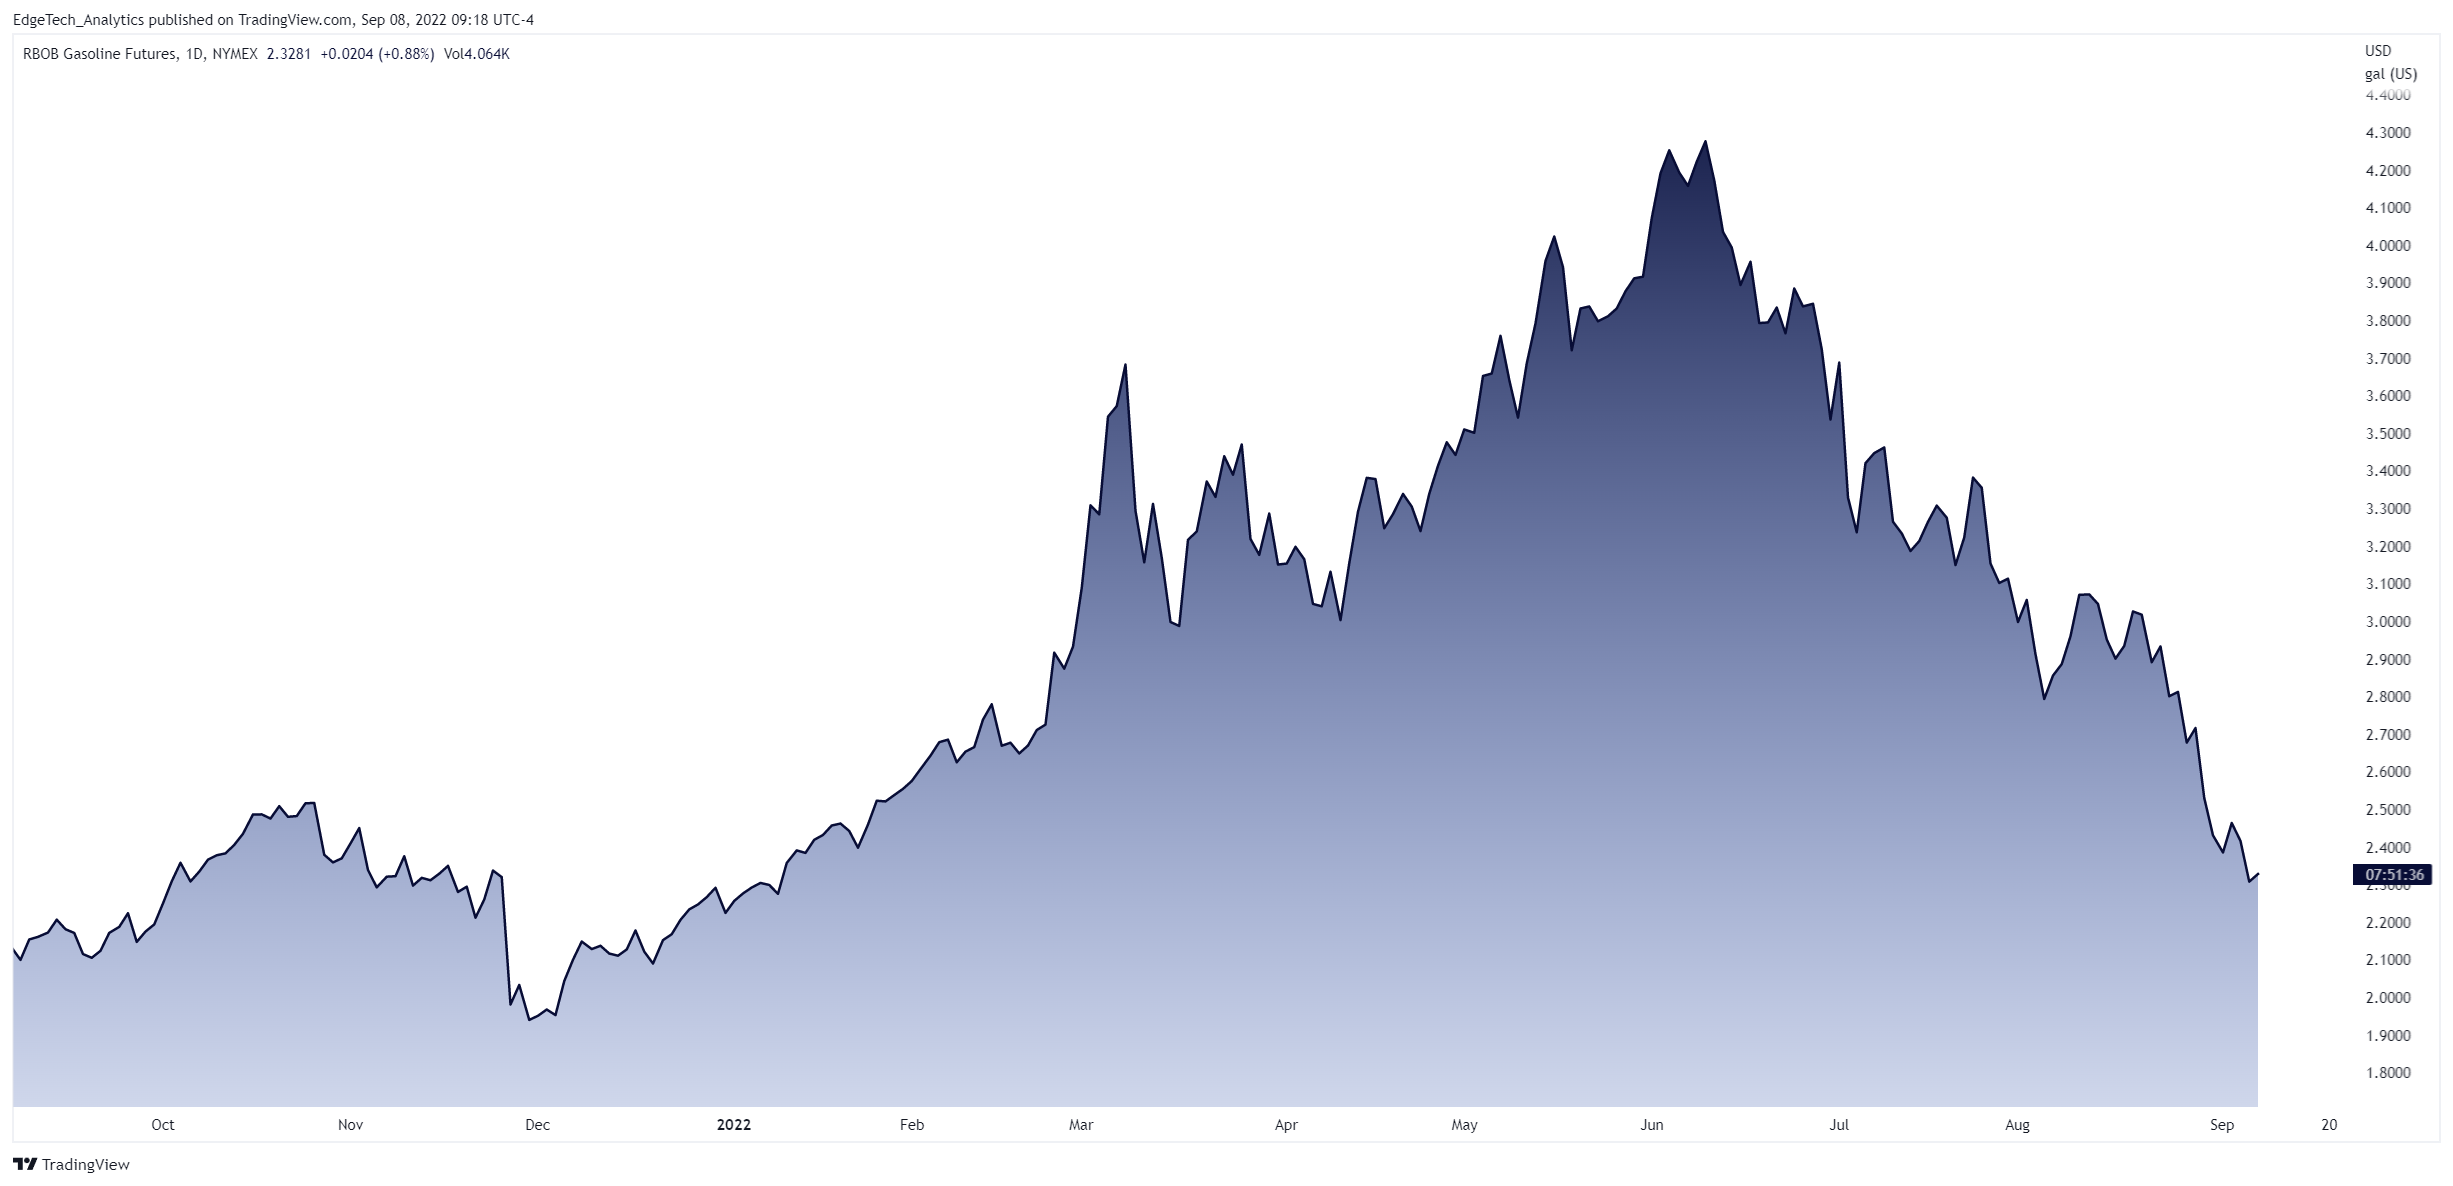
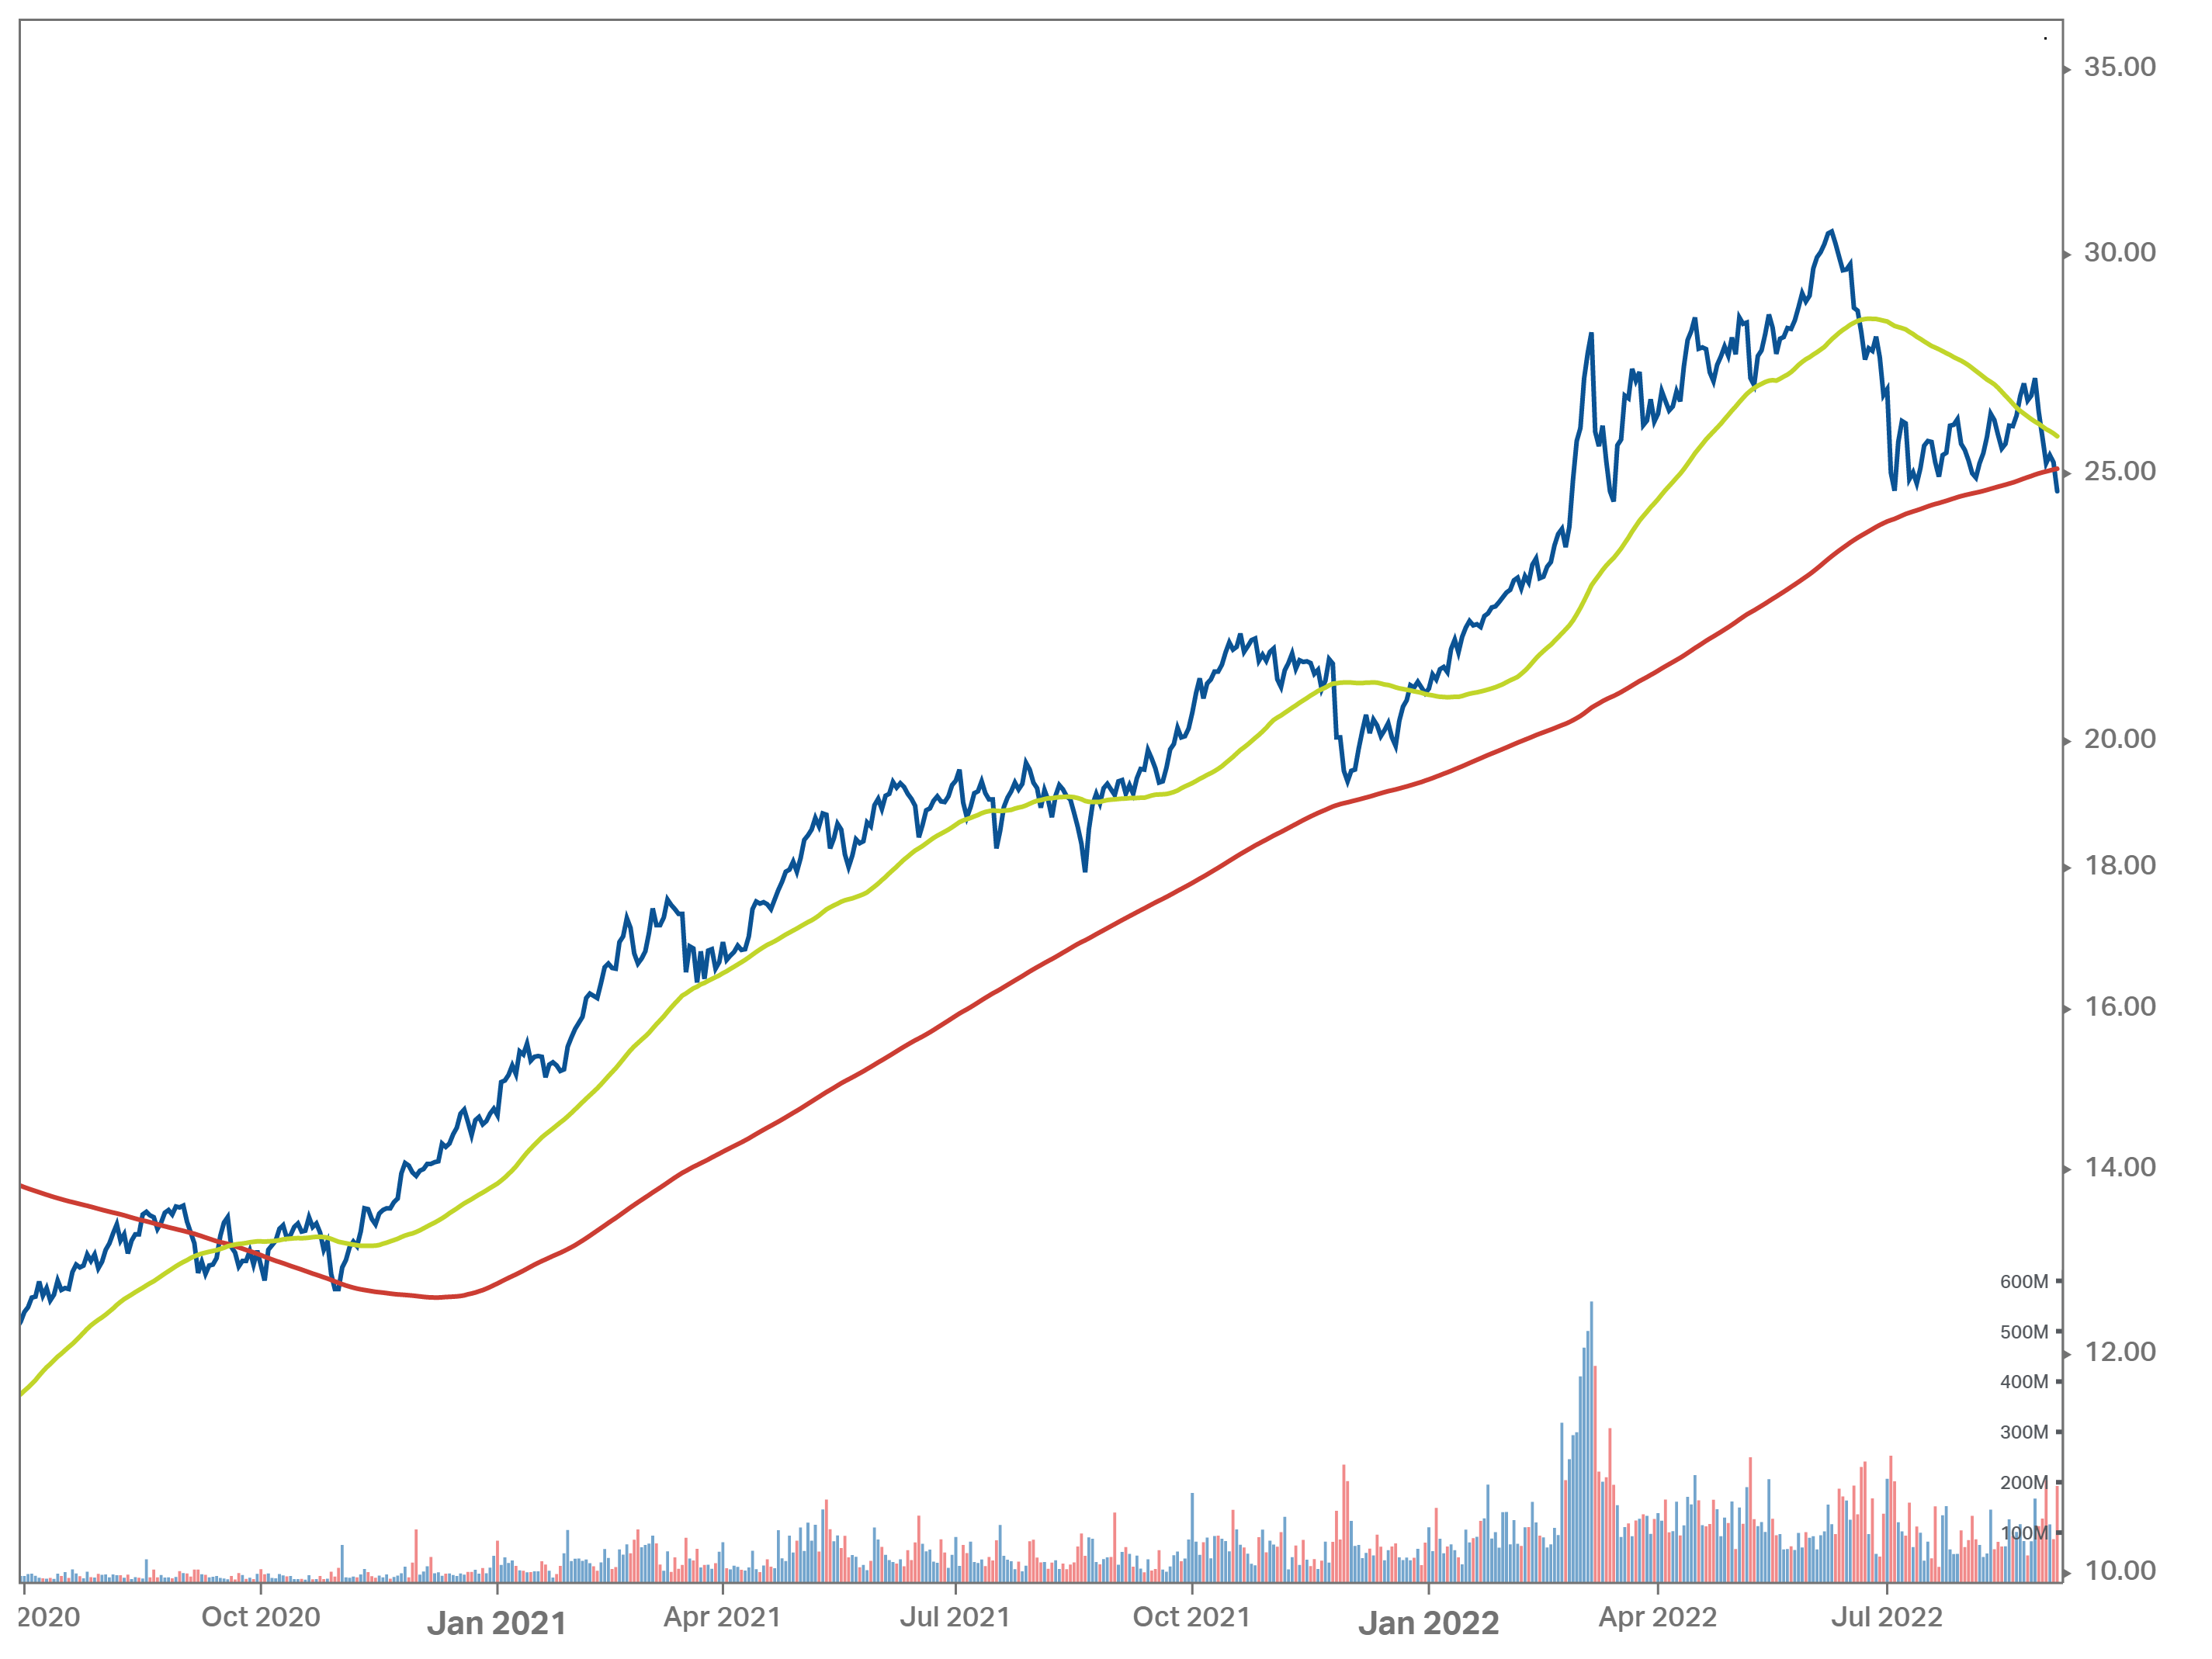
Gasoline futures currently at $2.30…should translate to $3.15/gallon in about a month. The broad basket commodities index ETF, DBC, fell below its 200-day moving average for the first time since October of 2020.
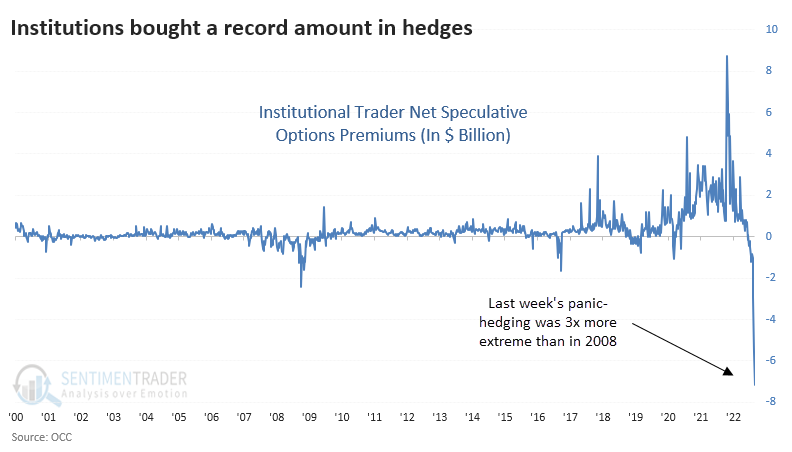
EXHIBIT 4 - Institutions buying protection
Institutional traders bought record amounts of put options, hedging their positions to protect on anticipated downdrafts.
The views expressed above reflect the views of EdgeTech Analytics, LLC and are for informational purposes only. These views are not intended to serve as a substitute for personalized investment advice. Past performance is no guarantee of future results and no investment strategy or methodology can guarantee profits or protect against losses.