Categories
Blog

Powell’s Corrections of Market Misconceptions

Powell’s Corrections of Market Misconceptions

INFLATION • THE FED • JEROME POWELL

The late summer stock market rally was fueled by the market’s misconception of the severity of inflation and the seriousness of the Fed’s determination to defeat it. Chairman Jerome Powell offered correctives to these misconceptions in his speech at Jackson Hole last week.

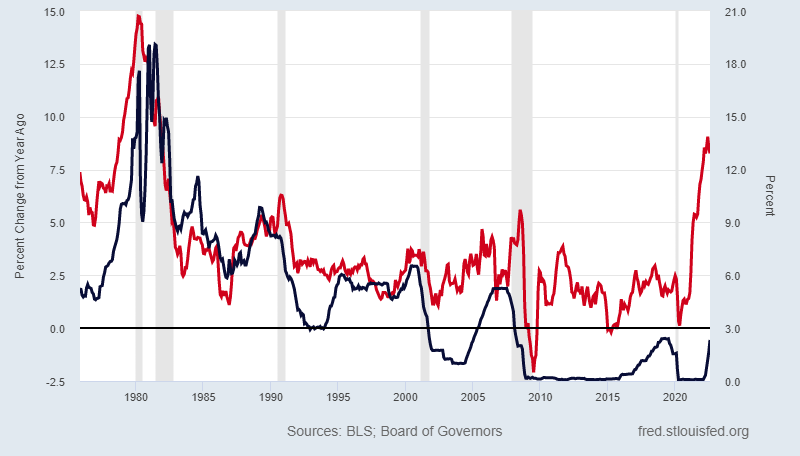
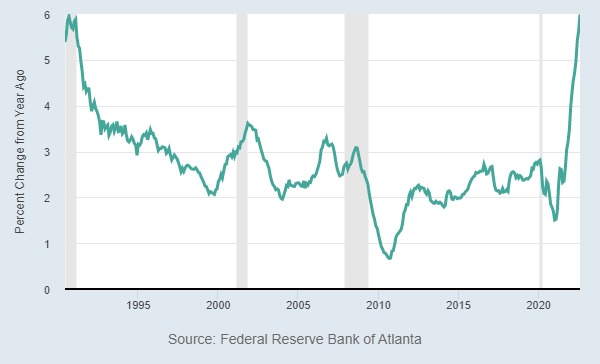
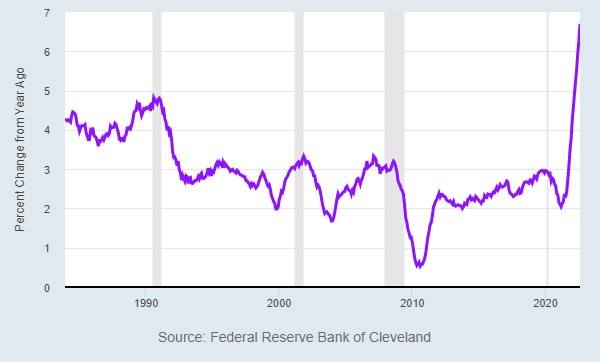
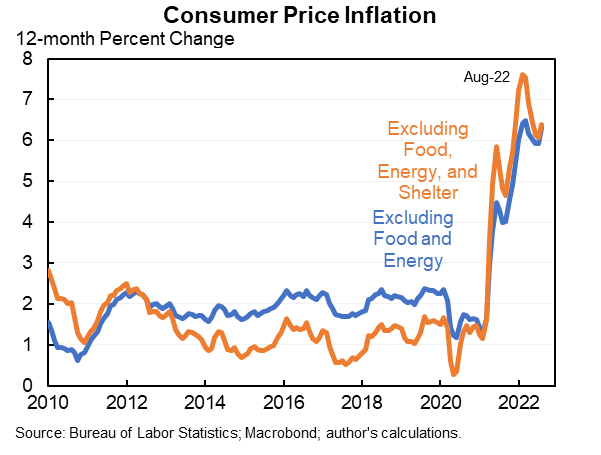
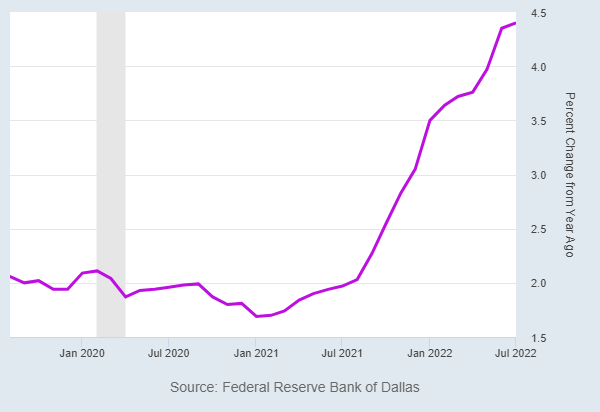
MISCONCEPTION #1: INFLATION’S PEAKED, NOT A BIG DEAL GOING FORWARD

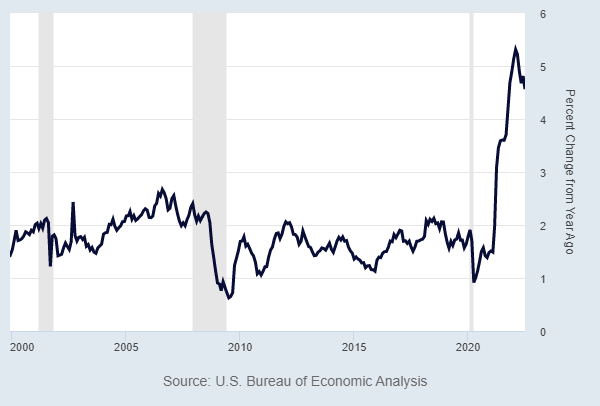
  • “High inflation has continued to spread through the economy.”
  • “Without price stability, the economy does not work for anyone.”
  • Reducing inflation is likely to require a sustained period of below-trend growth.
  • “While higher interest rates, slower growth, and softer labor market conditions will bring down inflation, they will also bring some pain to households and businesses.”
  • “These are the unfortunate costs of reducing inflation. But a failure to restore price stability would mean far greater pain.”

MISCONCEPTION #2: THE FED WILL PIVOT AND REVERSE COURSE:

  • “Restoring price stability will likely require maintaining a restrictive policy stance for some time.”
  • “The historical record cautions strongly against prematurely loosening policy.”
  • “We are taking forceful and rapid steps to moderate demand so that it comes into better alignment with supply, and to keep inflation expectations anchored. We will keep at it until we are confident the job is done.”

RESETTING EXPECTATIONS:

The market must reset its expectations and come to terms with the one-two punch of both inflation and interest rates that are going to be higher for longer.

The Fed’s commitment to taming inflation is going to slow the economy. This is their clearly stated goal.

With the reset of expectations comes the return of erratic price swings as the stock market becomes more volatile in anticipation of the Fed’s goal coming to fruition.

Going forward stocks are going to have a hard time gaining traction in a stagflationary, rising interest rate environment.

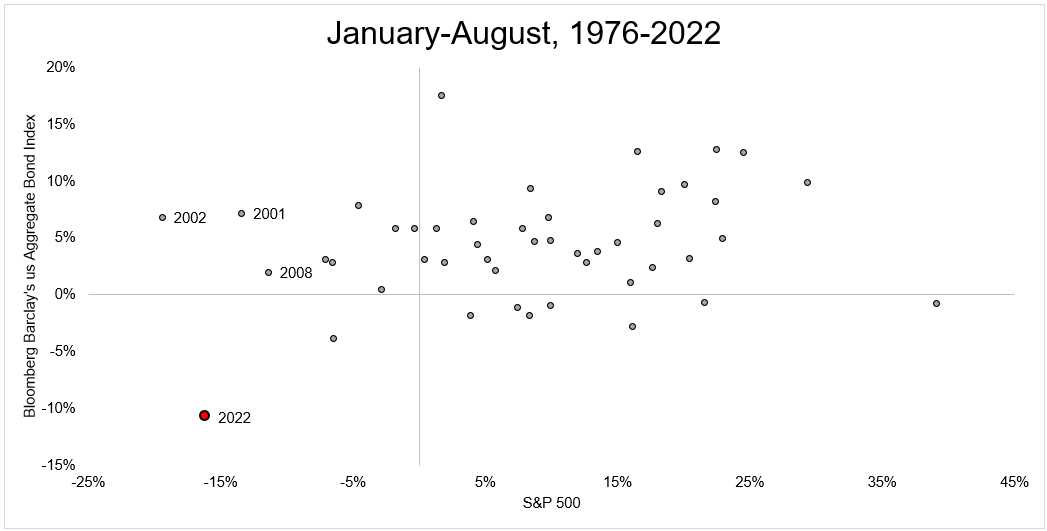
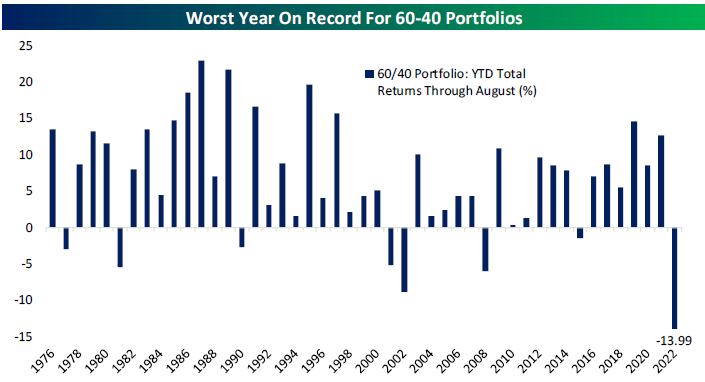
  • What explains the late-summer stock market rally that has already come to an abrupt end?
  • We think the stock market deceived itself into thinking that the Federal Reserve would dial back its interest rate hikes in response to the assumed peak in inflation.
  • The market misjudged both the severity of inflation and the seriousness of the Fed’s determination to defeat it.

This misjudgment was based on two things:

  • The perceived dovishness of Chairman Jerome Powell, and
  • Memories of the Fed’s quick reversal (aka “pivot”) of their rate hikes in 2019 in response to a similar stock market sell-off.

The difference this time is entrenched, elevated inflation.

  • It is literally the Fed’s job to maintain stable prices.
  • Since it became apparent that inflation isn’t transitory, the Fed has been absolutely clear about their intentions to stabilize prices regardless of the pain this will cause the economy and the stock market. 
  • And far from being the stock market’s backstop, the Fed has not minced words about its willingness to inflict pain in order to lower prices.
    • As Chairman Powell stated last week, higher rates will, “bring some pain to households and businesses. But a failure to restore price stability would mean far greater pain.
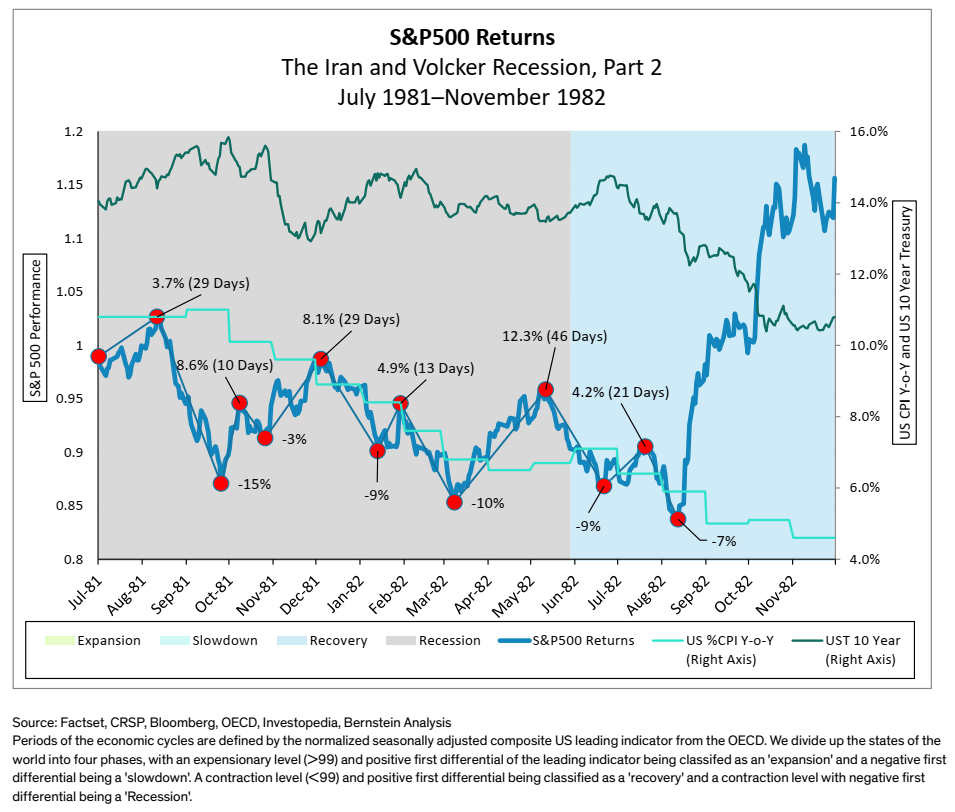
  • Instead of a Fed pivot we got a Fed double down. They are  resolved not to repeat their mistakes from the 1970s when they eased before inflation was dead and buried. 
  • They couldn’t be more clear that they will follow their mandate and hike interest rates until they are confident that inflation is moving down.

©2022 EdgeTech Analytics, LLC. All rights reserved. For informational purposes only. This is not an offer to buy or sell any securities. No investment strategy is free from risk and there is no guarantee that any strategies mentioned herein will be profitable. Past performance is not indicative of future performance.

Share This Post

Share on facebook
Share on linkedin
Share on twitter
Share on email

More To Explore

Categories
Market Commentary

Talking Points: September 16, 2022

Talking Points: September 16, 2022

STOCK MARKET • S&P • FED UPDATE

THIS WEEK

The keyword for markets going forward is instability.

Following Tuesday’s unexpectedly higher CPI numbers, the market has been forced to abandon its hope for a quick end to inflation and a Fed pivot.

Instead markets must confront the following:

Inflation that is going to be higher for longer.

  • Most tellingly, the inflation measures most representative of entrenched inflation (Core CPI, Median and Trimmed Mean CPI, and Sticky CPI) are not showing any signs of slowing down (see charts below).
  • Outside of gasoline, food prices affect consumers most and food prices are not moderating. Food inflation was up +11.5% and grocery inflation is running at +13.5% year-over-year (highest since 1979).

A Federal Reserve that is laser-focused on defeating inflation.

  • The Fed is not going to pivot anytime soon.
  • As Chairman Powell stated at Jackson Hole, they are willing to take “forceful and rapid steps to moderate demand.”

Higher interest rates until prices moderate enough to satisfy the Fed.

  • More rate hikes are on the way as the terminal Fed Funds rate may need to be even higher in order to effectively curb demand (see chart below).

Slower demand means a slowing economy means reduced earnings.

  • A recession may be needed to stop stubborn inflation.
  • Investors must be prepared for such a recession/slowdown to show up in a company’s bottom lines.

This makes for an unstable, uncertain market.

  • There are few catalysts to buy when the market is staring down the barrel of the inevitable: a forced economic contraction that might, we hope, stabilize prices.

KEY TAKEAWAYS

Slowdown arriving soon? Atlanta Fed’s most recent estimate for Q3 GDP growth falls to 0.5%.

  • The certainties for this economy (higher rates, falling demand) make for an uncertain stock market.
  • Uncertainty for stocks means volatility.
  • Further whipsaws, bear market rallies, and high magnitude intra and interday moves are to be expected in the coming months.
  • We are seeing further defensive tactical allocations to cash and cash-like instruments as a way to approach this trendless market.

MARKET CHARTS

EXHIBIT 1 - Inflation and the fed funds rate

Here we see the rate of inflation (red line) and the effective Fed Funds Rate (blue line). Hiking the Fed Funds Rate is a key part of how the Fed is trying to bring inflation down.

You can see how low the rate remains even after the hikes so far this year. Does this imply the rate needs to be much higher to pull inflation down?

EXHIBIT 2 - fed isn’t budging from being “forceful and rapid” in their hikes

Sticky CPI: highest since ’82, no signs of slowing down.

Median CPI: highest ever recorded (index started in ’83), not slowing.

Core Core CPI: excludes food, energy and shelter, still above 6%.

EXHIBIT 3 - Stock returns and last inflationary regime

During our last bout of elevated inflation and rising interest rates stocks didn’t bottom until over two years after the peak in inflation. In between? Sideways movement with whipsaws and bear market rallies.

EXHIBIT 4 - bonds don't hedge equities in inflationary world

©2022 EdgeTech Analytics, LLC. All rights reserved. For informational purposes only.

The views expressed above reflect the views of EdgeTech Analytics, LLC and are for informational purposes only. These views are not intended to serve as a substitute for personalized investment advice. Past performance is no guarantee of future results and no investment strategy or methodology can guarantee profits or protect against losses.

Share This Post

Share on facebook
Share on linkedin
Share on twitter
Share on email

More To Explore

Categories
Technology

Talking Points: September 9, 2022

Talking Points: September 9, 2022

FED • STOCK PRESSURE • S&P500 DOWN

THIS WEEK

Conflicting economic data this week only added to the general confused, unstable direction of markets.

The ISM Services PMI came in over expectations, increasing month-to-month, and in expansionary territory. The ISM Manufacturing PMI also came in over expectations staying flat in August.

  • Neither index is indicating recession and both continue to show steadily falling prices (good news for inflation).

Regardless, the Fed has made clear that further rate hikes are a certainty. The questions facing investors now are:

Will the Fed break something in its quest to quash inflation?

If it does, what will it break?

  • Look for deterioration in the housing market (definitely in a correction; still a ways to go to get back to normal), labor market (showing significant strength; few signs of loosening), broad economic demand (GDP), or the stock market (lower lows; lower multiples).

Is a soft landing possible?

  • Again the labor market is showing continued strength (jobless claims have fallen for 4 straight weeks; see also increased participation numbers from last week’s Talking Points), and manufacturing and services indexes continue to show expansionary levels with falling prices.

Stocks remain under pressure.

The S&P 500 remains down -17% from its peak.

  • The index has traded below its 200-day moving average for over 100 trade days. This is the longest streak since the Great Financial Crisis (2009).

The Nasdaq remains down -26% from its peak.

  • Like the S&P, the Nasdaq has traded below its 200-day moving average for over 100 trade days; also the index’s longest streak since 2009.

ELECTIONS APPROACHING

MARKETS LIKE DIVIDED GOVERNMENT, POST-MIDTERM YEARS

MARKET CHARTS

EXHIBIT 1 - aggregate bond index off to its worst-ever start

The AGG’s inception was 1976, before the runaway inflation of 1979-1980, and this year remains far and away the index’s worst start ever.

EXHIBIT 2 - 60/40 portfolio’s worst year on record

The chart below left, from Michael Batnick, charts the S&P 500 returns on the horizontal axis and the Aggregate bond return on the vertical axis. You can see that 2022 is in a league of its own.

EXHIBIT 3 - Inflationary pressures easing? Commodities bull fading?

Gasoline futures currently at $2.30…should translate to $3.15/gallon in about a month. The broad basket commodities index ETF, DBC, fell below its 200-day moving average for the first time since October of 2020.

EXHIBIT 4 - Institutions buying protection

Institutional traders bought record amounts of put options, hedging their positions to protect on anticipated downdrafts.

©2022 EdgeTech Analytics, LLC. All rights reserved. For informational purposes only.

The views expressed above reflect the views of EdgeTech Analytics, LLC and are for informational purposes only. These views are not intended to serve as a substitute for personalized investment advice. Past performance is no guarantee of future results and no investment strategy or methodology can guarantee profits or protect against losses.

Share This Post

Share on facebook
Share on linkedin
Share on twitter
Share on email

More To Explore

Categories
Market Commentary

Talking Points: August 26, 2022

Talking Points: August 26, 2022

STOCK PERFORMANCE • TODAY’S VOLATILITY • INFLATION

THE WEEK

Stocks having their worst single day performance since June on Chairman Jerome Powell reiterating what he’s been saying all year long: the Fed is dead set on fighting inflation and will not pull back on rate hikes until they see enough evidence that prices are coming down.

  • The Fed is intent on not repeating the mistakes of the 1970s where they prematurely loosened monetary conditions which led to inflation’s resurgence later in the decade.
  • Because of this, the market’s hoped-for “dovish pivot” seems unlikely at least through the end of this year.

Powell committed the Fed to “taking forceful and rapid steps” and to “keep at it until we are confident the job is done.” (emphasis added).

Today’s volatility is noise—recall that a market pricing in perfection makes it extremely fragile—but it does indicate a resetting of expectations to a more realistic bent.

  • Inflation is still much too high and tighter financial conditions will hurt the economy and company bottom lines.
  • Sideways and negative volatility through the market’s worst month, September, are to be expected in the run up to the next round of rate hikes on the 21st.

POSITIVES:

  1. University of Michigan Consumer Sentiment for August, while still low, beat expectations.
  2. Inflation expectations, which play a significant role in the life cycle of rising prices, decreased in August.
  3. Q2 GDP growth was revised upward; it’s still negative but not as deeply negative.
  4. PCE inflation, the Fed’s preferred measure, eased in July month-over-month and year-over-year.

NEGATIVES:

  1. S&P Composite business activity index came in at contraction levels for the month.
  2. Regional manufacturing indexes continue to show deep contractions  in activity.
  3. Trimmed Mean PCE inflation (this excludes all outlier prices) still advanced in July although the pace of the increase was mild.

KEY TAKEAWAYS

Sideways and negative volatility through September for equity markets.

  • The Nasdaq is still in a bear market (-23% away from its high) and the S&P is still -14% from its high.

We’re keeping an eye on the 10-year Treasury yield. 

  • The yield headed north of 3% with the Fed’s latest hawkishness and stock swoon. 
  • It peaked at 3.48% in June right around the stock market’s bottom.

The Fed is committed to smashing inflation and the market has to come to terms with the implications for the economy and balance sheets.

MARKET CHARTS

EXHIBIT 1 - Post 50% Recovery mark a bottom?

  • Of the 16 times the S&P 500 has dropped -20% and recovered 50% of those losses, it has never made a new low.

EXHIBIT 2 - Don’t want to see you in September

  • Post-Summer markets have historically underperformed (the average monthly performance is -.7%).
  • After September and October volatility, however, the market tends to rise throught the end of the year.

EXHIBIT 3 - Inflation easing, remains high

  • The Fed’s favorite measure of inflation, the Personal Consumption Expenditures (PCE) index excluding food and energy, continues to trend downward year-over-year. Note that it’s still at 4.6%, more than double the preferred rate of inflation.
  • The Trimmed Mean PCE number removes both positive and negative outliers and still shows prices increasing, albeit at a slower rate than we saw in June.

EXHIBIT 4 - Bear Market Perspectives

  • As you can see the 2000s bear markets went thousands of days without reaching new highs. We’re currently at 162 days.

©2022 EdgeTech Analytics, LLC. All rights reserved.

Important Disclosures: The views expressed above reflect the views of EdgeTech Analytics, LLC and are for informational purposes only. These views are not intended to serve as a substitute for personalized investment advice. Past performance is no guarantee of future results and no investment strategy or methodology can guarantee profits or protect against losses.

Share This Post

Share on facebook
Share on linkedin
Share on twitter
Share on email

More To Explore

Categories
Market Commentary

Talking Points: August 19, 2022

Talking Points: August 19, 2022

INTERNAL MARKET MOMENTUM • LATEST MARKET RALLIES

KEY TAKEAWAYS

Internal market momentum cannot and should not be ignored.

Unlike the rallies earlier this year, this latest rally is showing broad participation and real momentum.

  • Over 90% of S&P 500 stocks are trading above their 50-day moving average. In contrast, during March’s growth rally only 74% of stocks were trading at those levels and that level was reached for only a single trade day. We’ve had over 90% now for 4 straight trade days.
  • The S&P 500 recovered over 50% of its losses last Friday (the “retracement” we discussed last week). Equity returns 2 and 3 months out following such recoveries have been positive in almost all cases. Not a guarantee but a decent signal of forward momentum.
  • Breadth has improved: the percentage of S&P 500 stocks hitting new 20-day highs reached over 55%. This is a bullish signal that’s only occurred 28 other times since the 1970s. The last time it happened recently was May 2020.
  • It is impossible to say whether this is another dead-cat bounce or a new bull breakout, though the momentum indicates further upside potential in the short term (see charts below).

The stock market is pricing in perfection: inflation gradually recedes, the Fed eventually pivots, and the economy lands softly.

  • Pricing for perfection means extreme fragility: any negative inflation data point has the potential to burst this bubble of optimism.

The Fed’s July meeting minutes revealed that they’re happy about July’s inflation moderating though they remain committed to stamping out inflation.

  • They will be data-dependent going forward and gave no hint of a pivot.
  • The Fed saw “little evidence to date that inflation pressures were subsiding.” More hikes coming.

Next Friday we get July’s Personal Consumption Expenditures data (the Fed’s preferred measure of inflation).

Bear Rally/Bull Breakout?

  • As you can see from this chart, the magnitude of this latest rally is not unusual for bear markets (2022 is the black line).
  • This rally, however, has had legitimate momentum and participation indicating further upside.

MARKET CHARTS

EXHIBIT 1 - S&P 500 stocks trading above 50-day moving average

  • This infrequently seen number is used as one of the signals for a potential bull market breakout.
  • Note the dates of other occurrences and performance of the stock market post the 90% trigger being met.

EXHIBIT 2 - From indiscriminate selling to indiscriminate buying a good sign

  • This chart looks at times when just 10% of the S&P 500’s stocks that were trading above their 50-day moving average went to over 90% trading above it in 3-month periods.
  • Going from indiscriminate selling to buying has been positive for forward stock performance in the past.

EXHIBIT 3 - Momentum Thrusts

  • Again, this is a market priced for perfection at some point in the future and is extremely vulnerable to external shocks or inflation data coming in higher than expected.
  • That being said, the momentum of this current rally indicates the potential for further positive returns going forward.

EXHIBIT 4 - Lots of cash on sidelines/not yet participating

  • The August BofA fund manager survey showed fund managers still heavily in cash and underweight stocks.

©2022 EdgeTech Analytics, LLC. All rights reserved.

Important Disclosures: The views expressed above reflect the views of EdgeTech Analytics, LLC and are for informational purposes only. These views are not intended to serve as a substitute for personalized investment advice. Past performance is no guarantee of future results and no investment strategy or methodology can guarantee profits or protect against losses.

Share This Post

Share on facebook
Share on linkedin
Share on twitter
Share on email

More To Explore

Categories
Market Commentary

Talking Points: July 29, 2022

Talking Points: July 29, 2022

TECHNICAL RECESSION ARRIVES, FED HIKES RATE • MARKETS OPTIMISTIC, VOLUME LIGHT • SLOWDOWN OCCURING, IMMINENT

KEY TAKEAWAYS

The market has been optimistic about equities this month.

July has been the market’s calmest month volatility-wise, and it has been quiet in terms of active trading (volume).

In a week where we both entered a technical recession (2 consecutive quarters of economic contraction) and the Fed hiked interest rates another 0.75%, stocks shrugging these conditions off does not appear to us to be based on any valid, stable market narrative.

In a week where we both entered a technical recession (2 consecutive quarters of economic contraction) and the Fed hiked interest rates another 0.75%, stocks shrugging these conditions off does not appear to us to be based on any valid, stable market narrative.

The market is forward-looking and its current assessment of the second half—its sanguine view of the chances of a soft-landing (avoiding recession), the reduction in inflation, and the Fed’s dovishness—does not track with the data we’ve been observing this week.

Inflation remains high and the Fed has not minced words about devoting all of their attention to beating it regardless of whether or not this pushes us deeper into recession.

We are concentrating on the market filters in portfolios to help us determine the strength and durability of this latest rally.

We will also be deploying the bench to increase the number of assets, increase the number of check dates, and therefore increase the number of overall opportunities to reenter this market as lasting trends are uncovered.

This has been a frustrating stair-step rally with more ups than downs so far and with disappointing volume. Conviction, therefore, may be lacking.

Our tactical positions stand prepared to deploy should conviction strengthen and trends sustain upward momentum.

NYSE Total Volume - 20-day Moving Average

Back to January levels.

MARKET CHARTS

EXHIBIT 1 — U.S. Economy Enters Technical Recession

  • GDP growth contracted -0.9% in the second quarter; its second consecutive contraction.
  • The last time we had two quarters of contraction that wasn’t considered a recession was 1947.

EXHIBITS 2 & 3 — Consumer Spending & Sales Slowing

  • At left we see consumer spending contracting thanks to inflationary pressures such that it is contributing less to GDP.
  • At right we see “Real Final Sales” which is an excellent measure of demand that strips out exports and inventories from the GDP calculation. This shows that real final sales contracted last quarter for the first time since Covid; and before that the last time it contracted was the Great Financial Crisis.

EXHIBIT 4 — Unemployment Claims on Upswing

  • At left we see consumer spending contracting thanks to inflationary pressures such that it is contributing less to GDP.
  • At right we see “Real Final Sales” which is an excellent measure of demand that strips out exports and inventories from the GDP calculation. This shows that real final sales contracted last quarter for the first time since Covid; and before that the last time it contracted was the Great Financial Crisis.

©2022 EdgeTech Analytics, LLC. All rights reserved. For informational purposes only. This is not an offer to buy or sell any securities. No investment strategy is free from risk and there is no guarantee that any strategies mentioned herein will be profitable. Past performance is not indicative of future performance.

Share This Post

Share on facebook
Share on linkedin
Share on twitter
Share on email

More To Explore